Arms Exports
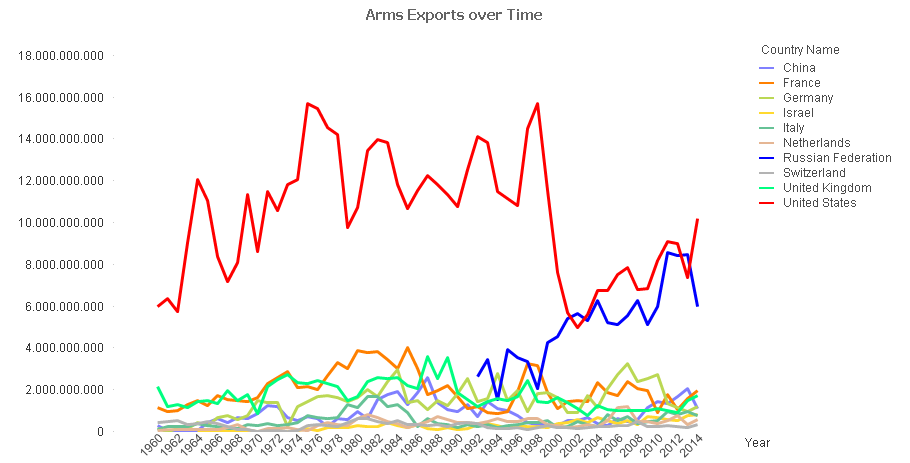
The arms exports over time of the 10 top exporting arms countries. There is a steep fall of arms exports of the USA beginning in 1998 and ending in 2002. As it correlates slightly with the rise of the Russian Federation as a weapons exporting country, it might be, that Russia took some of USA´s pie in weapon exports?
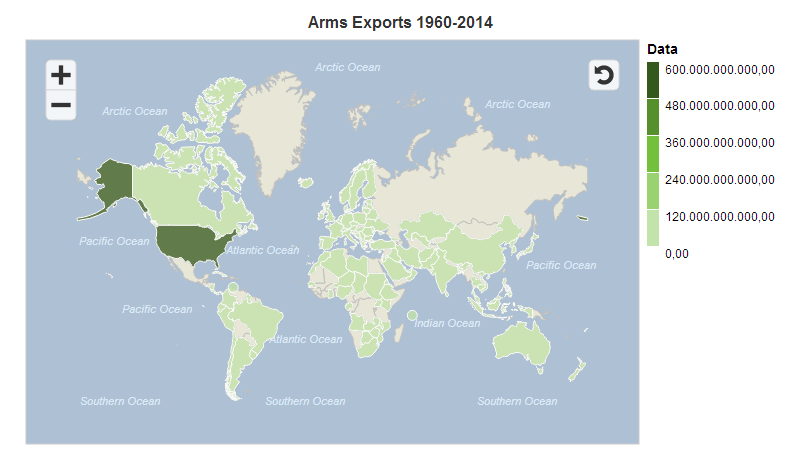
The volume of all arms exports in US dollar that have been done from 1960 to 2014 with all the data the data source (worldbank) had. (Actually the data for Russia is missing – the mapping was probably failing as the name in the dataset is Russian Federation and not Russia. Also the coloration wasn´t working perfectly, as the steps between the first and the third (with the second missing (Russia)) and onward are so big. I will try to do this again.).

The top 10 countries with the most arms exports from 1960 to 2014 in US dollar. With Russia you need to keep in mind, that the data only starts from the year 1992 (if we look however at the years from 1992 to 2014 only, we get pretty much the same picture, with the USA with twice as much exports as Russia). This changes only significantly in the years 2002 to 2014).
Arms Imports
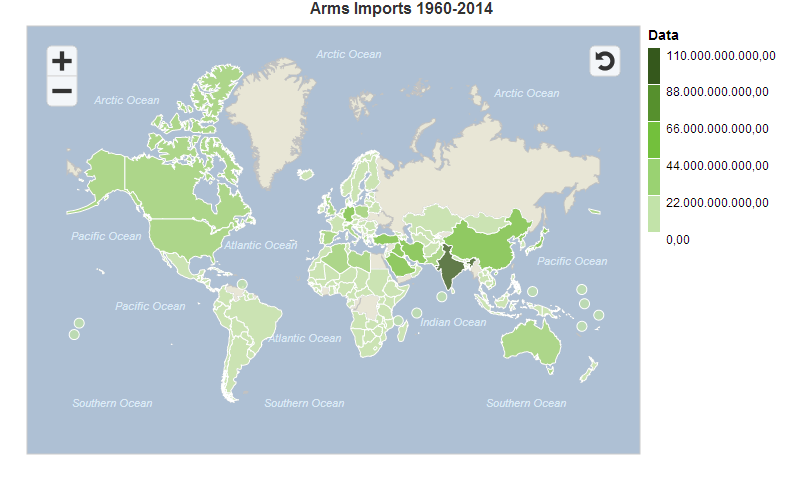
Total volume in US dollar of all the arms imports that have been made between 1960 to 2014 with data from the world bank.
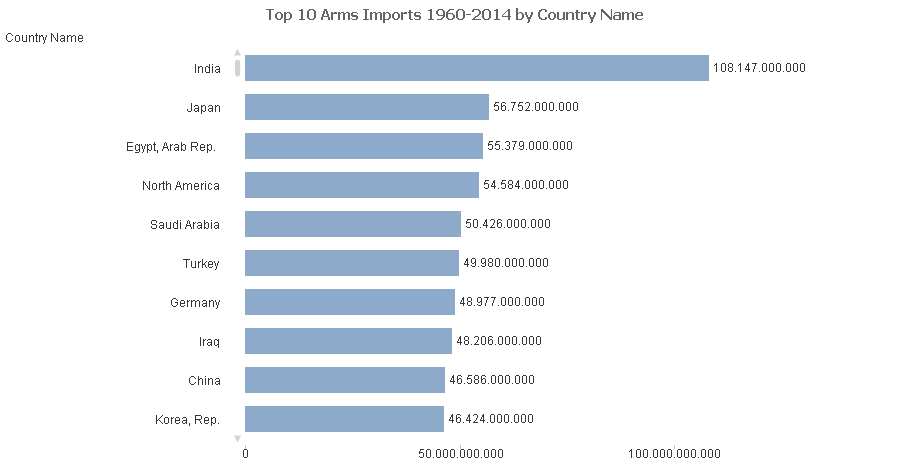
The 10 countries with the biggest arms imports in the years 1960 to 2014. Total Volume in US dollar. I was astonished how India is such a big importer of arms here.

The arms imports from 1960 to 2014 for the top 10 arms importing countries. It is hard to see any significant pattern for the top importing countries.
Datasource
I made this Data Visualisation with the Economy dataset from the Worldbank (http://datacatalog.worldbank.org/) and with the data visualisation software SAP Lumira and Qlik.
The dataset includes data from 1960 to 2014. The arms exports and imports are SIPRI trend indicator values (on their website you can find more data visualisations about this topic).
Schreibe einen Kommentar